Join us in transforming healthcare in Africa through Artificial Intelligence!
Watch the tutorials below on how to use ChatGPT for Data Analysis and use our Cheat Sheets for guidance on prompting.
Contact us for opportunities to partner in using AI tools to improve the accuracy and efficiency of data analysis:
Poster presented at the Grand Challenges Annual Meeting Dakar, Senegal, 8-11 October
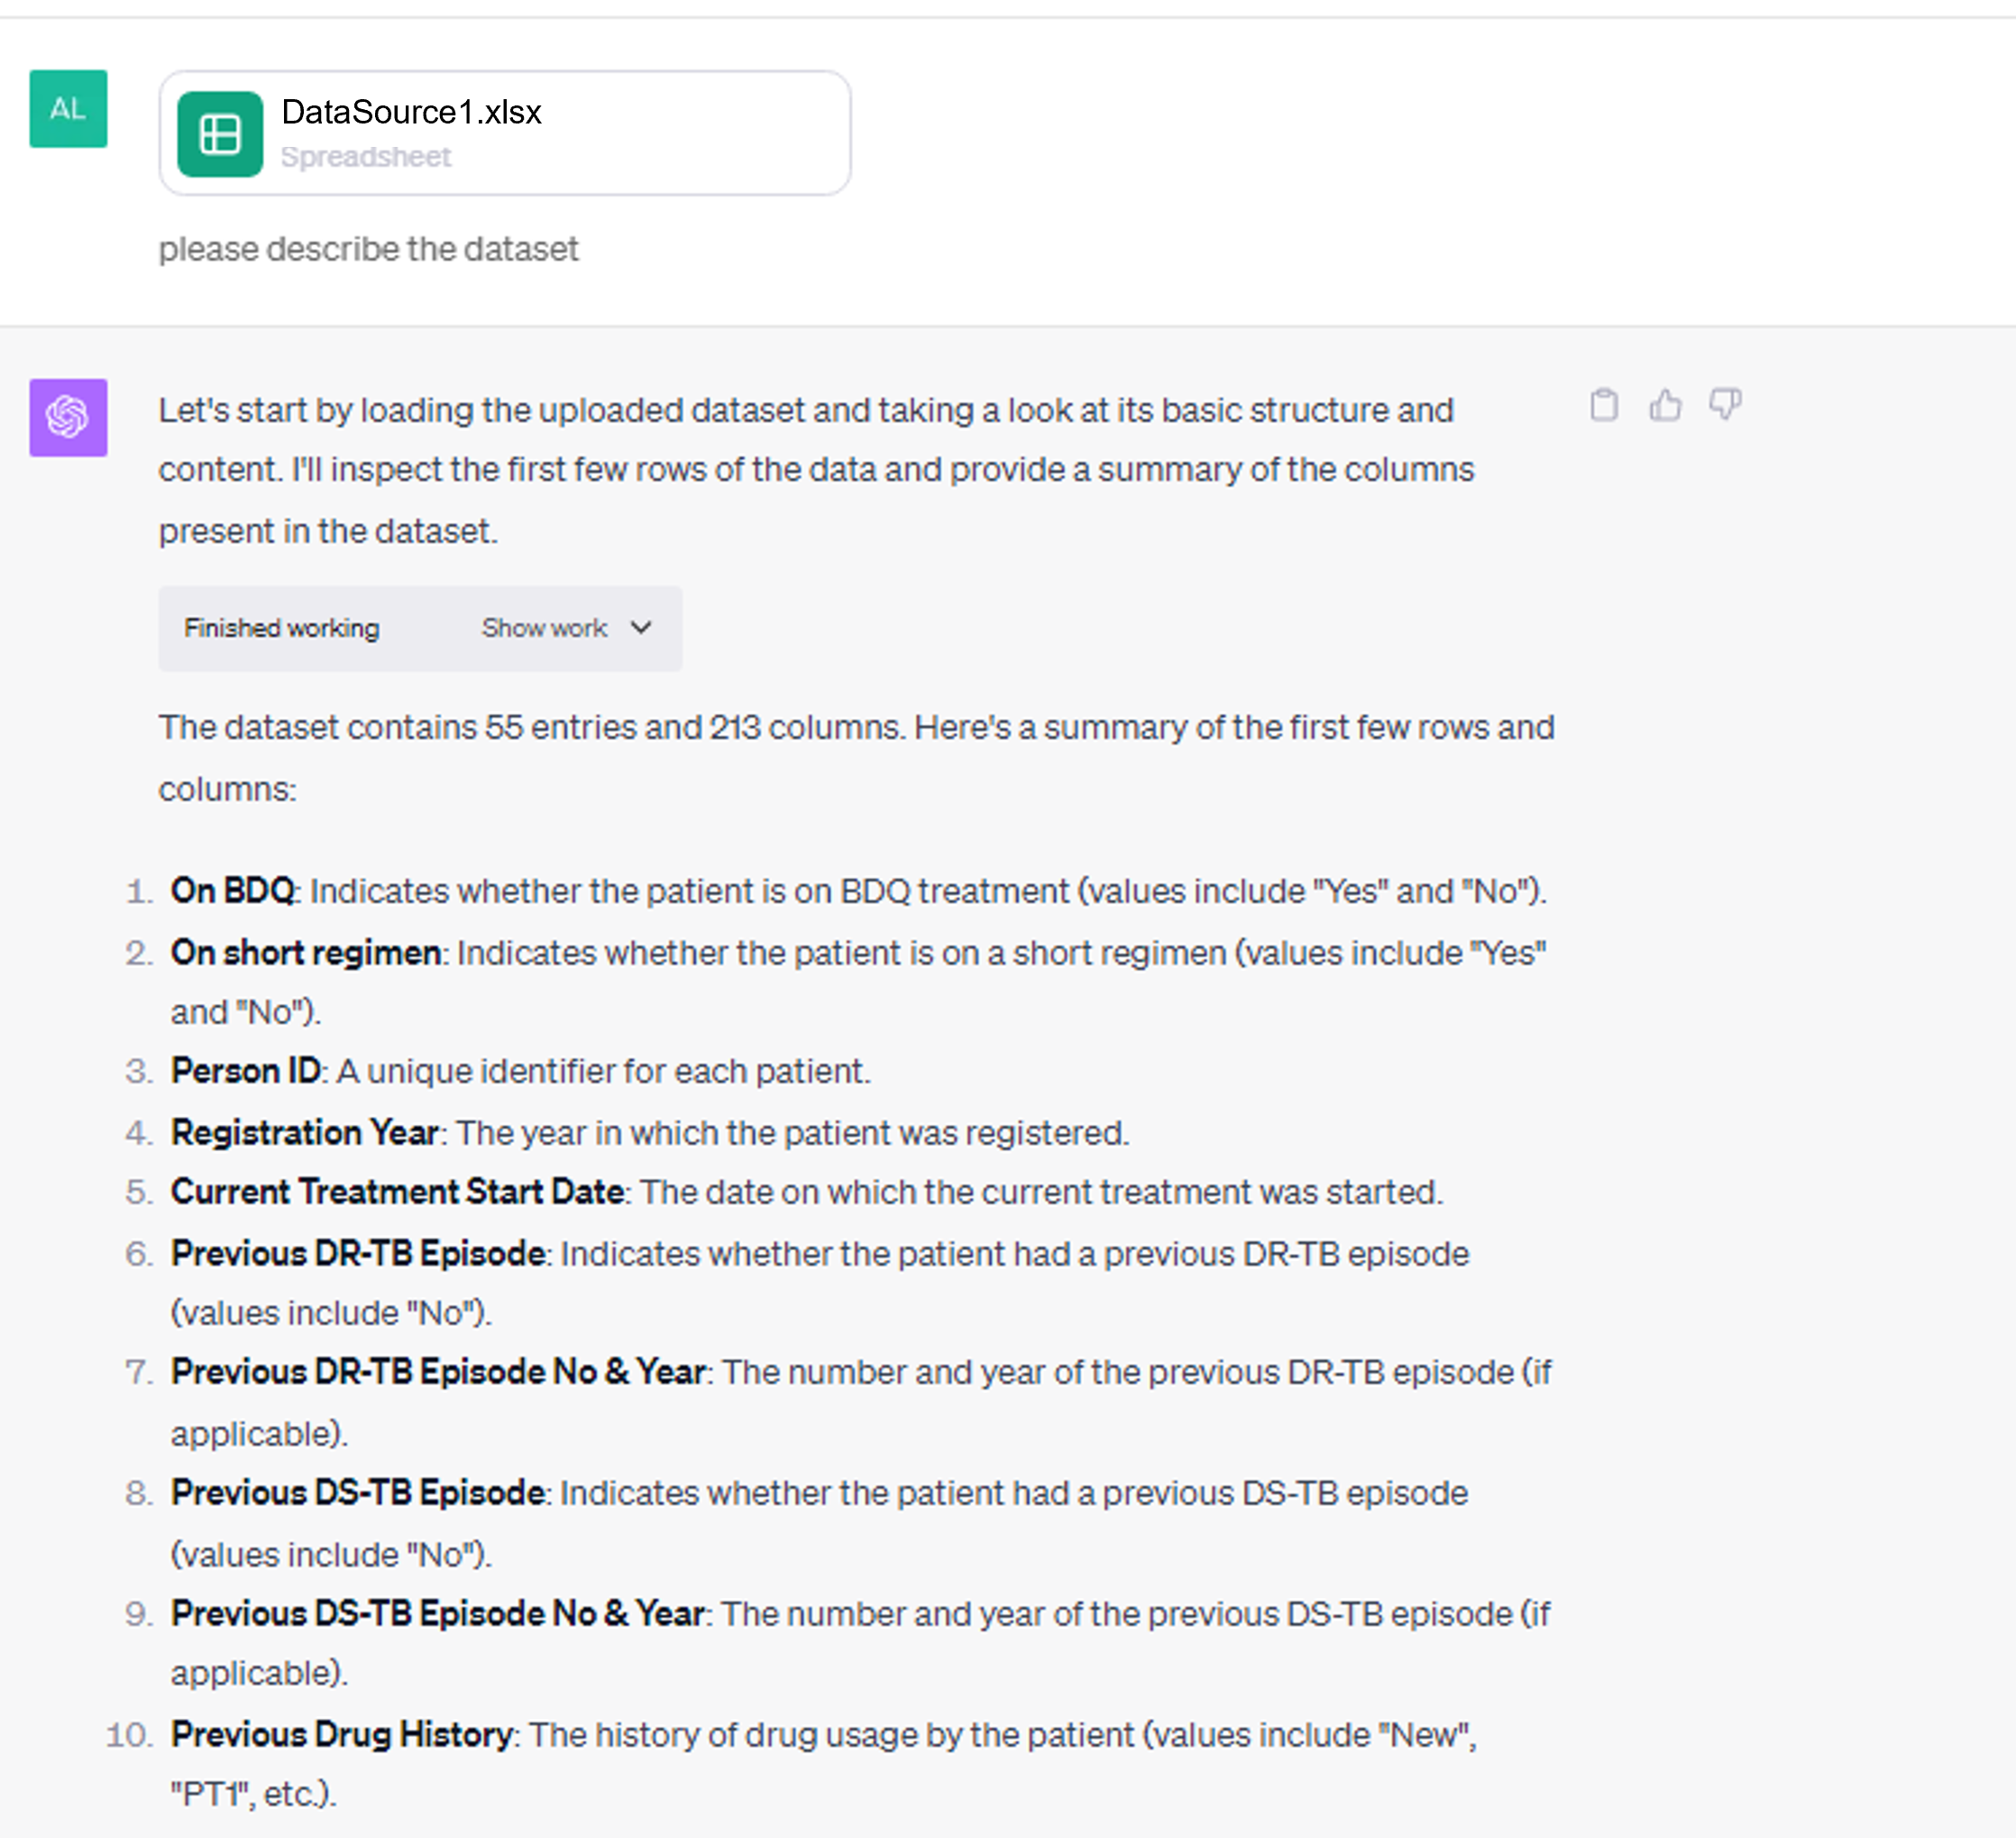
Description of a tuberculosis (TB) dataset
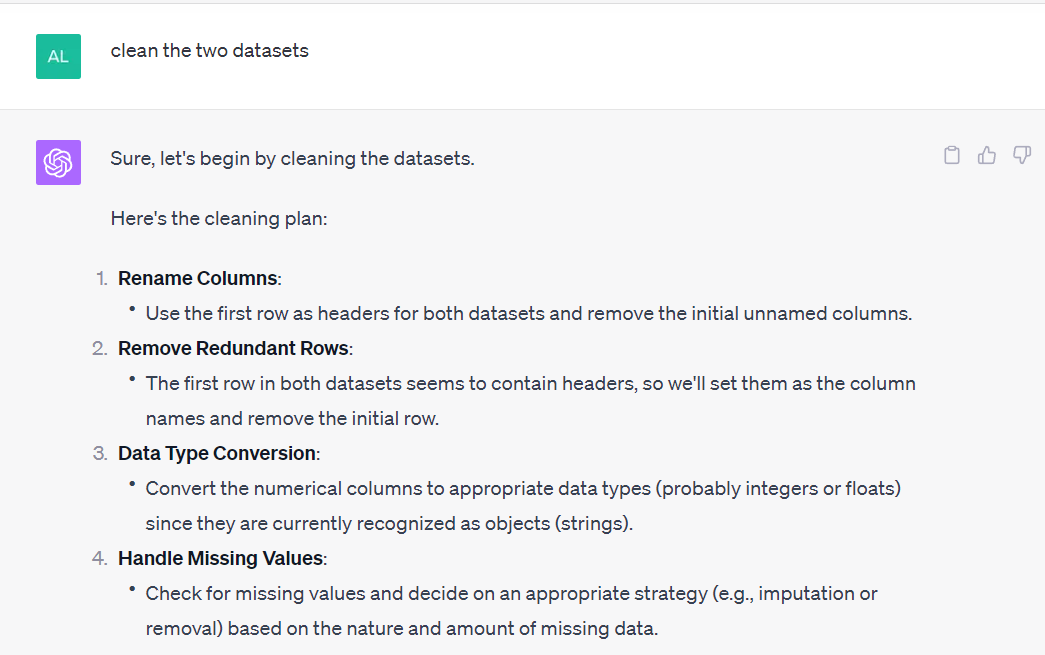
Data cleaning of TB datasets
Data cleaning of TB datasets
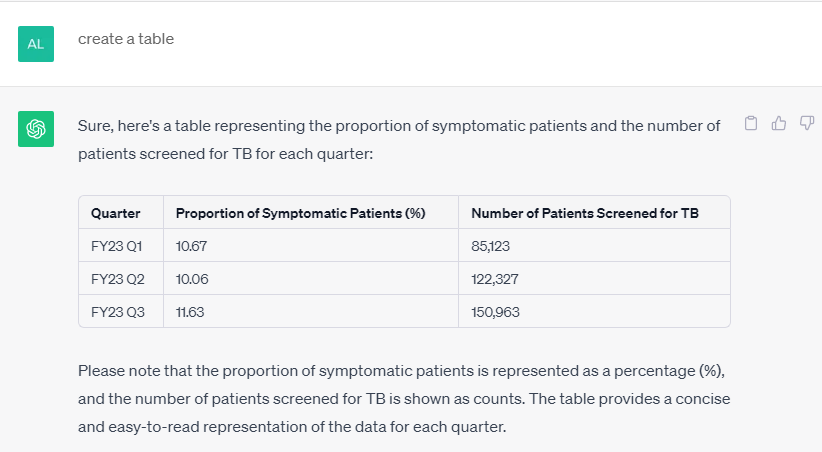
TB screening cascade
TB screening cascade
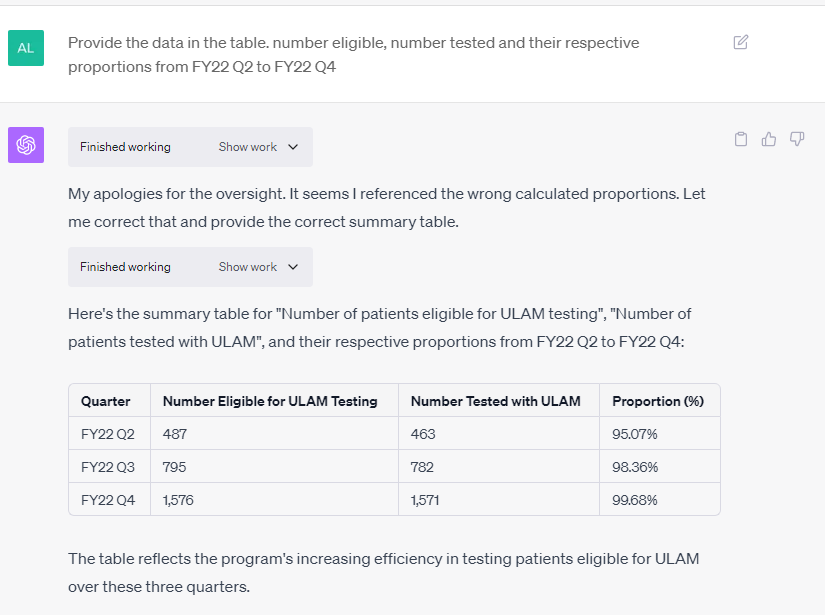
TB LF-LAM testing
TB LF-LAM testing
TB care cascade
TB care cascade
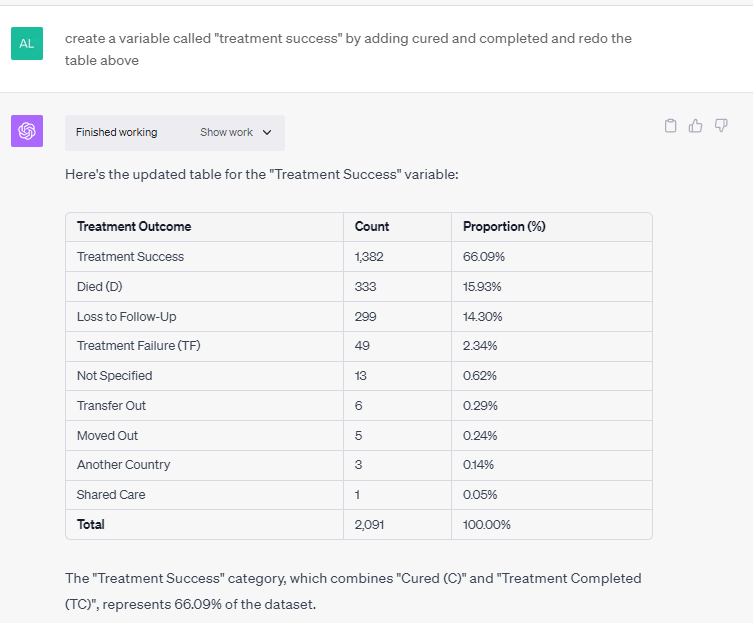
TB treatment outcomes
TB treatment outcomes
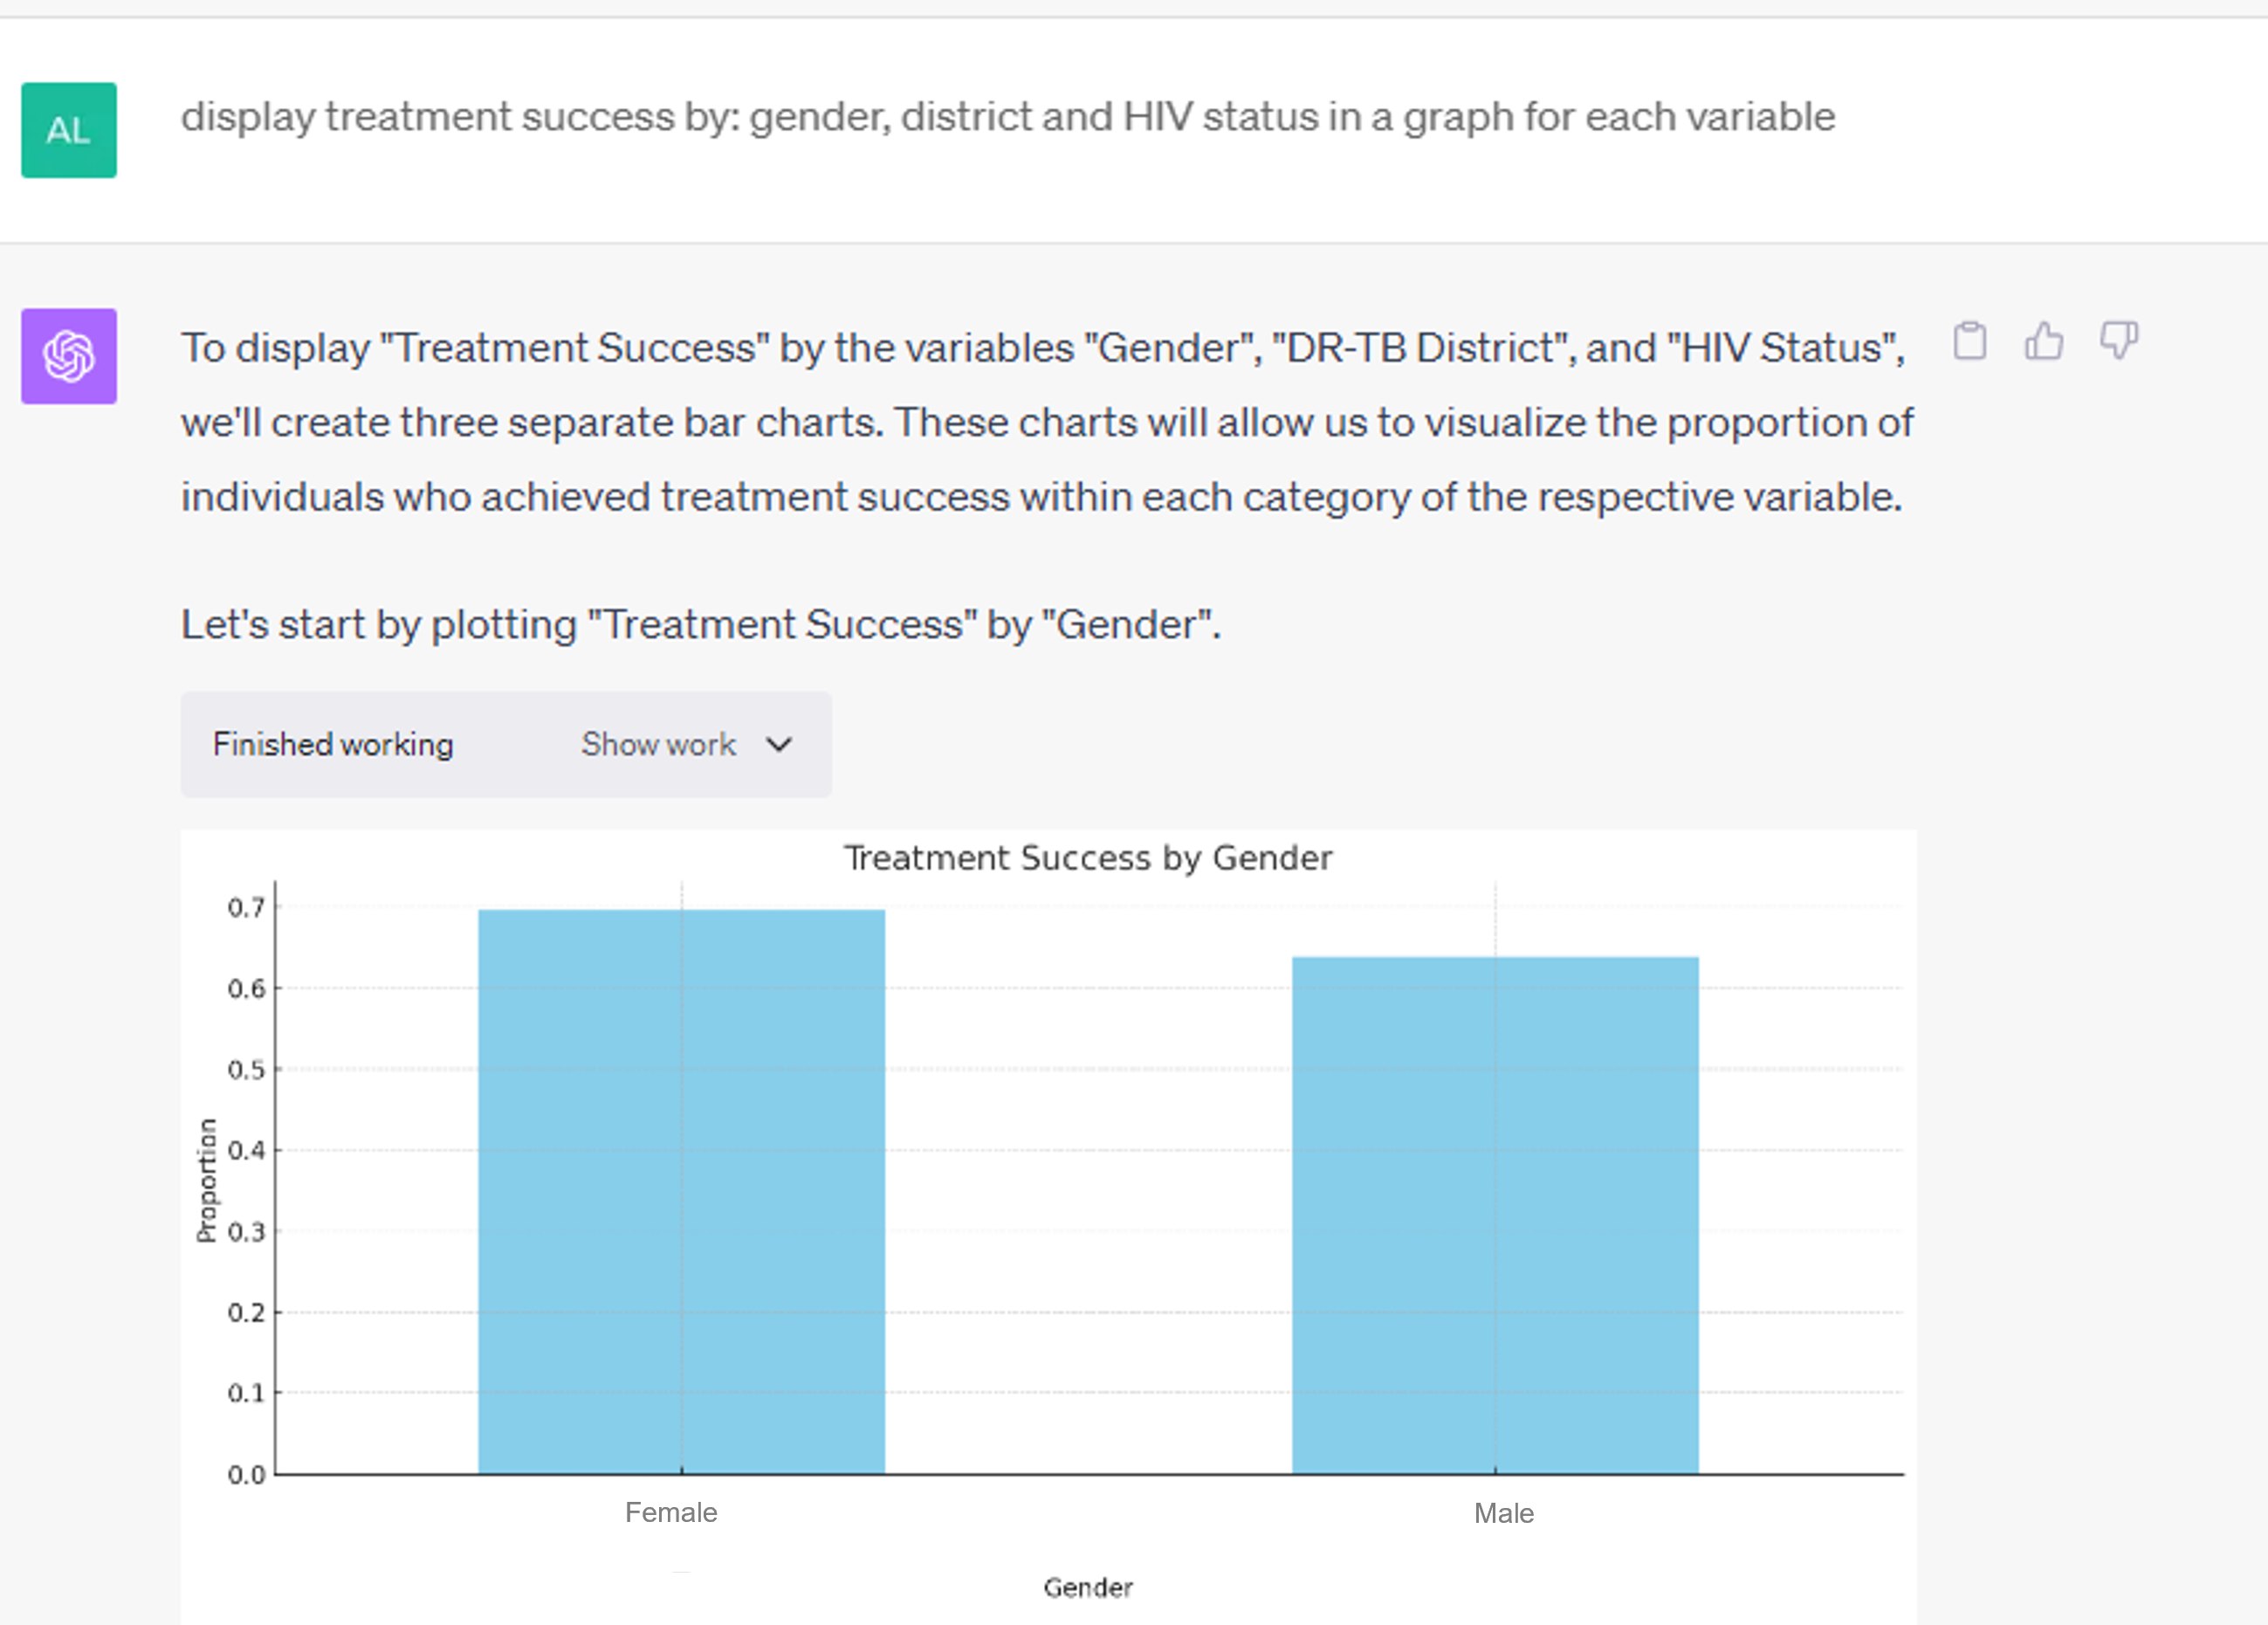
TB treatment outcomes based on gender
TB treatment outcomes based on gender
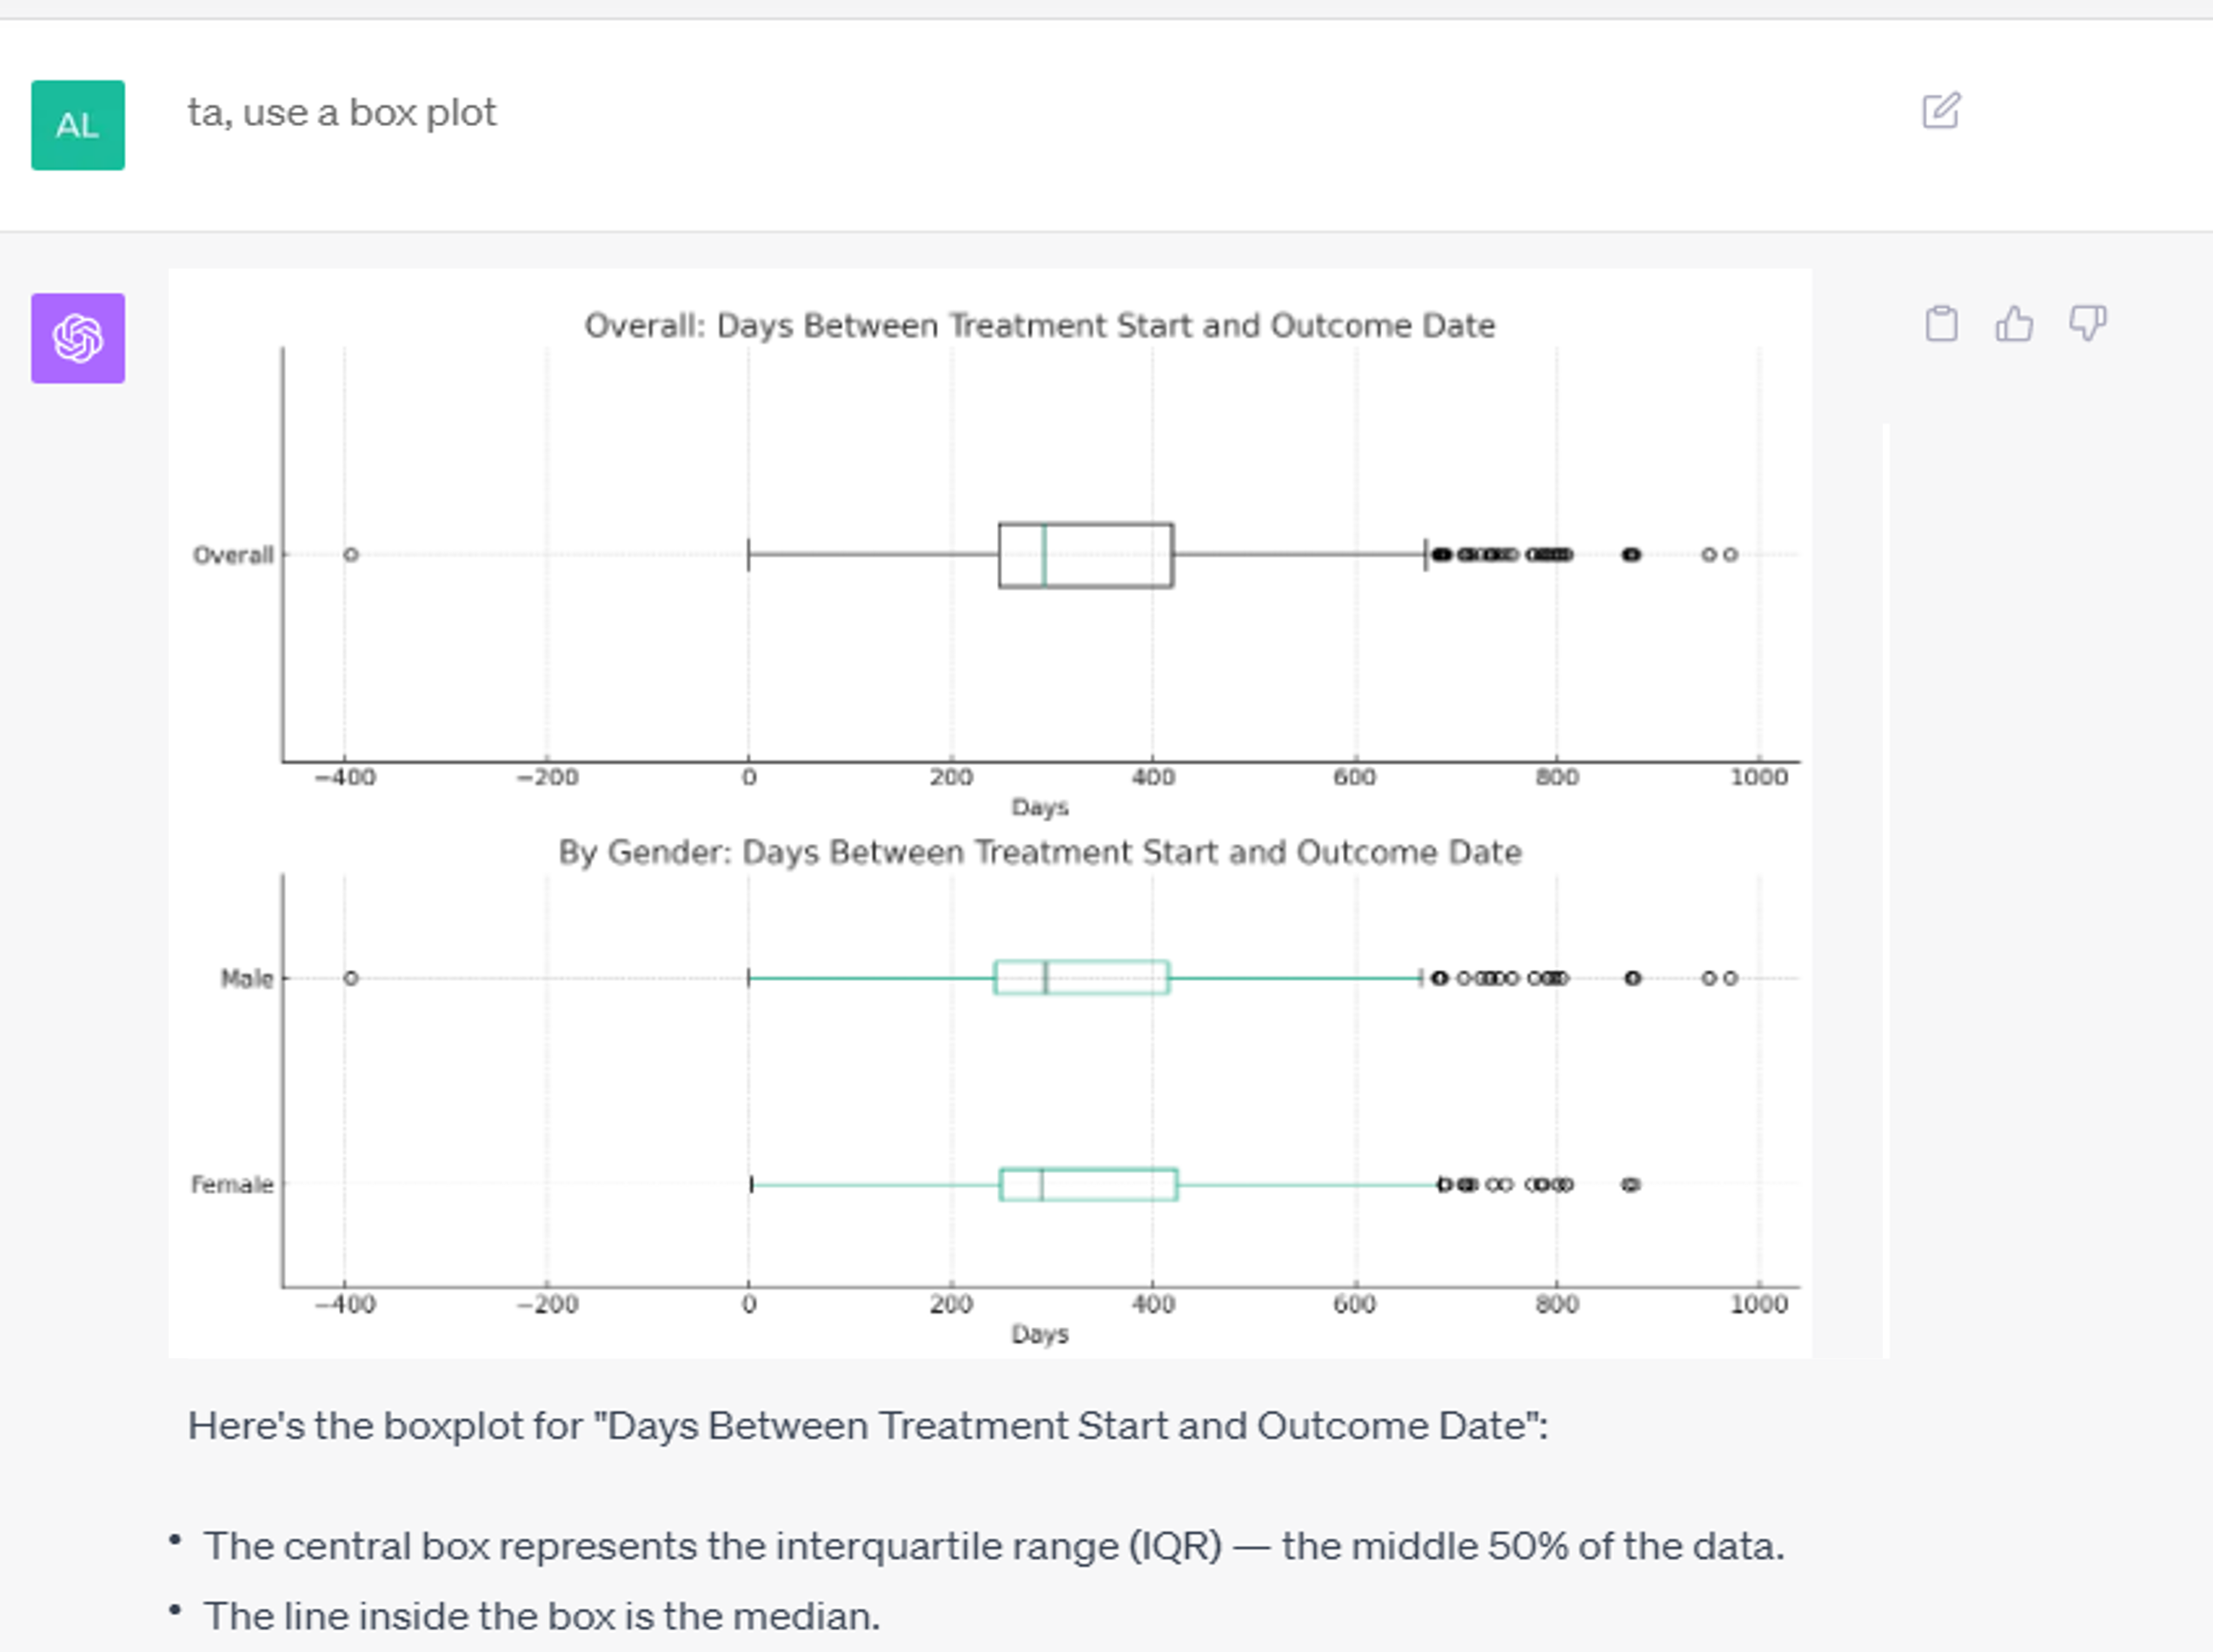
Box and whisker plots
Box and whisker plots
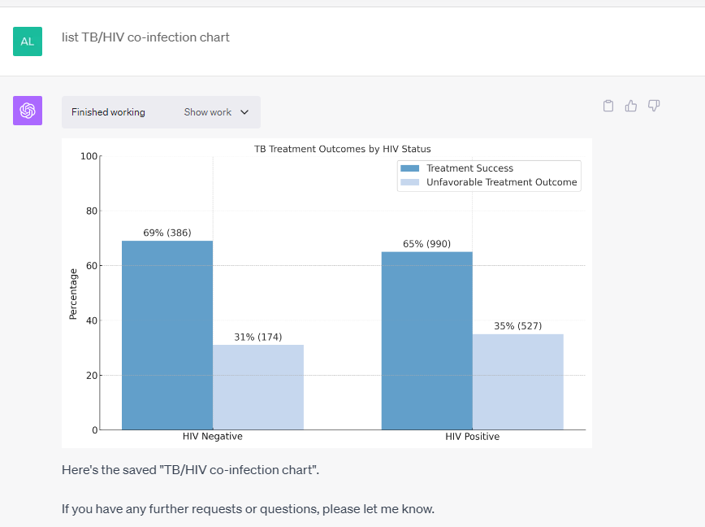
TB treatment outcome according to HIV status
TB treatment outcome according to HIV status
Key findings of a TB dataset
Key findings of a TB dataset
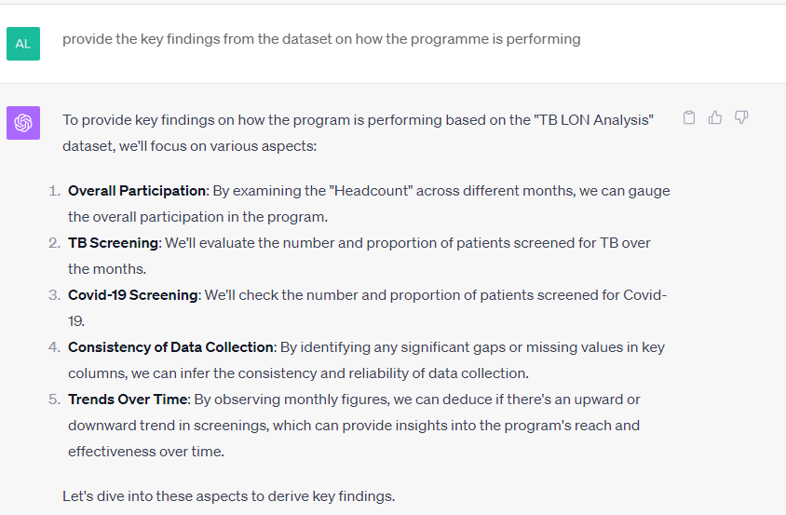
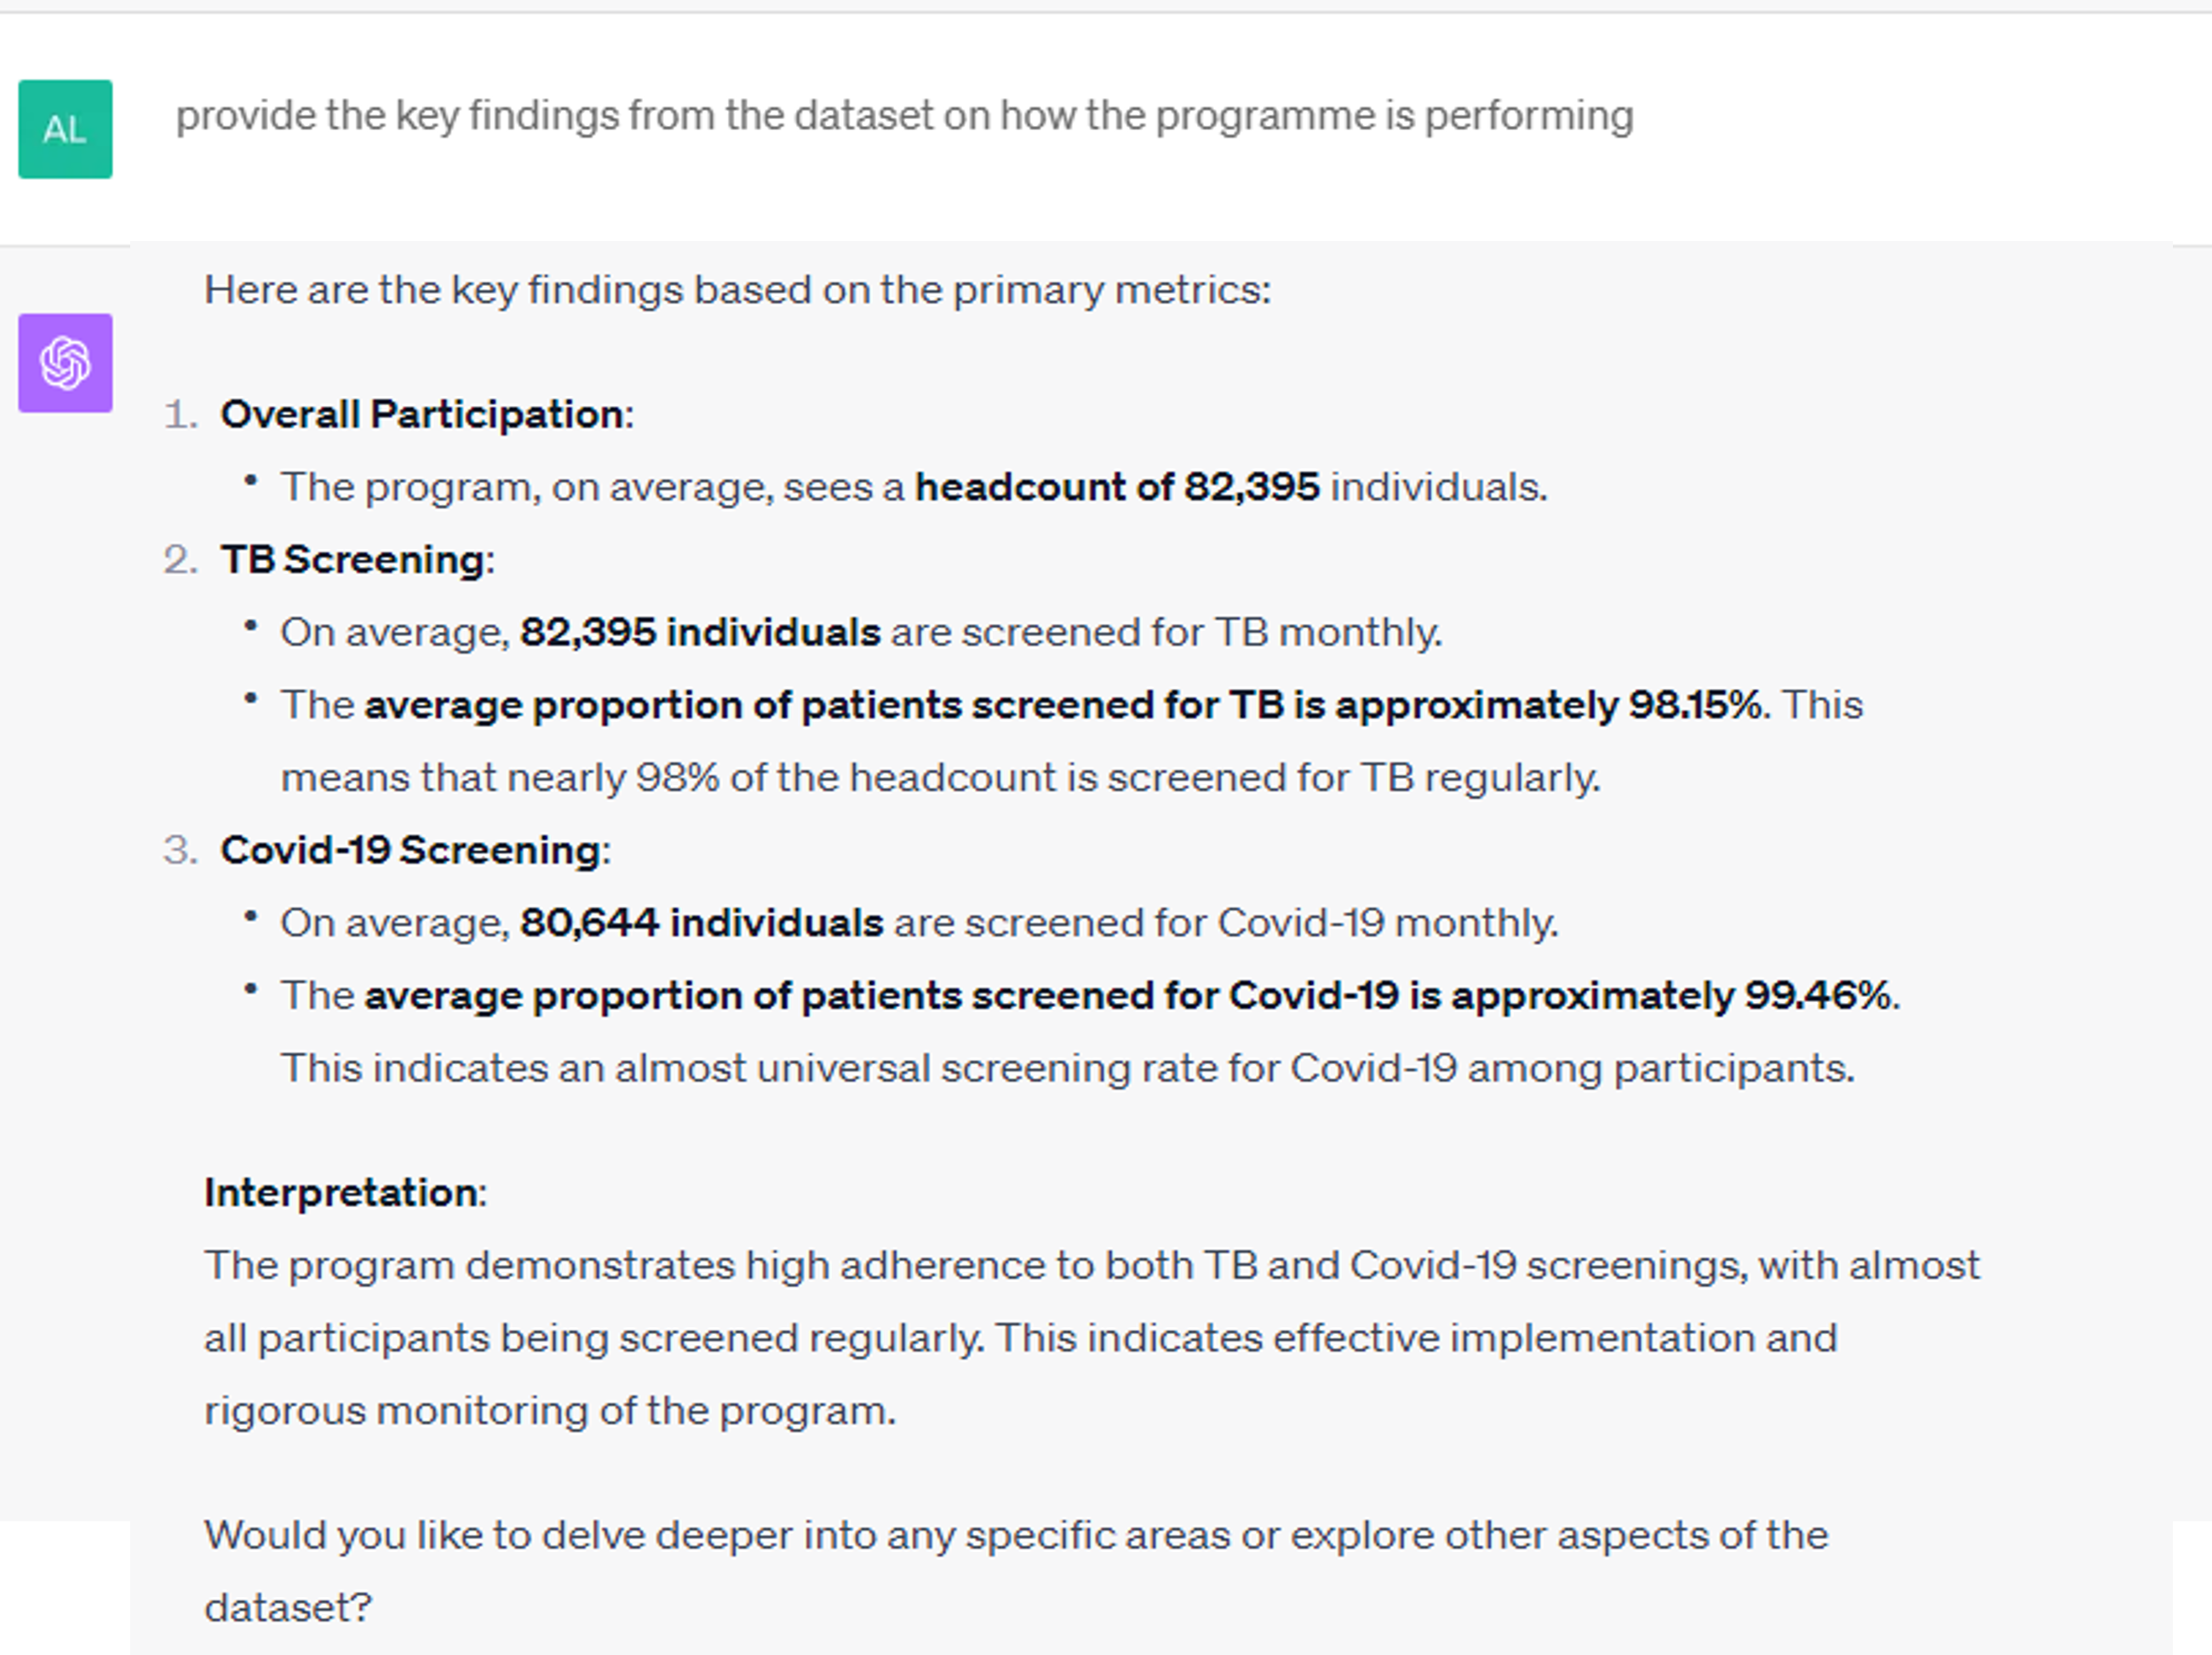
Key findings on TB programme performance
Key findings on TB programme performance
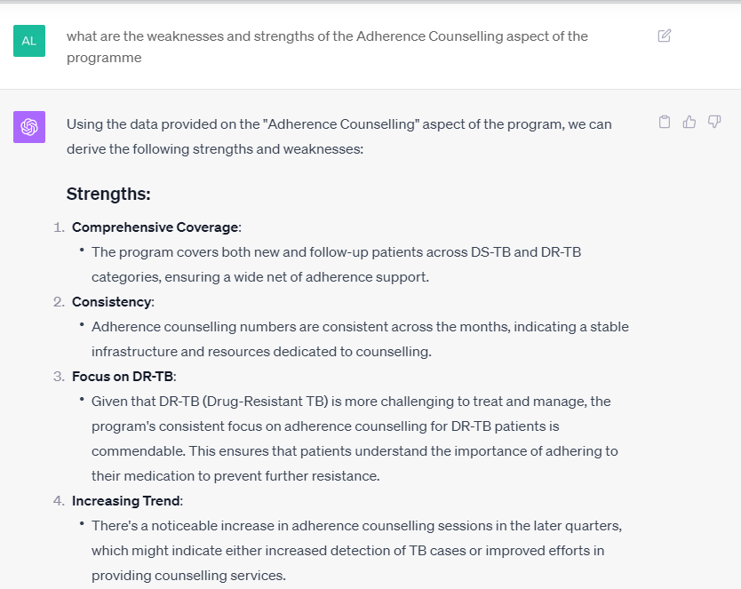
Adherence counselling programme strengths
Adherence counselling programme strengths
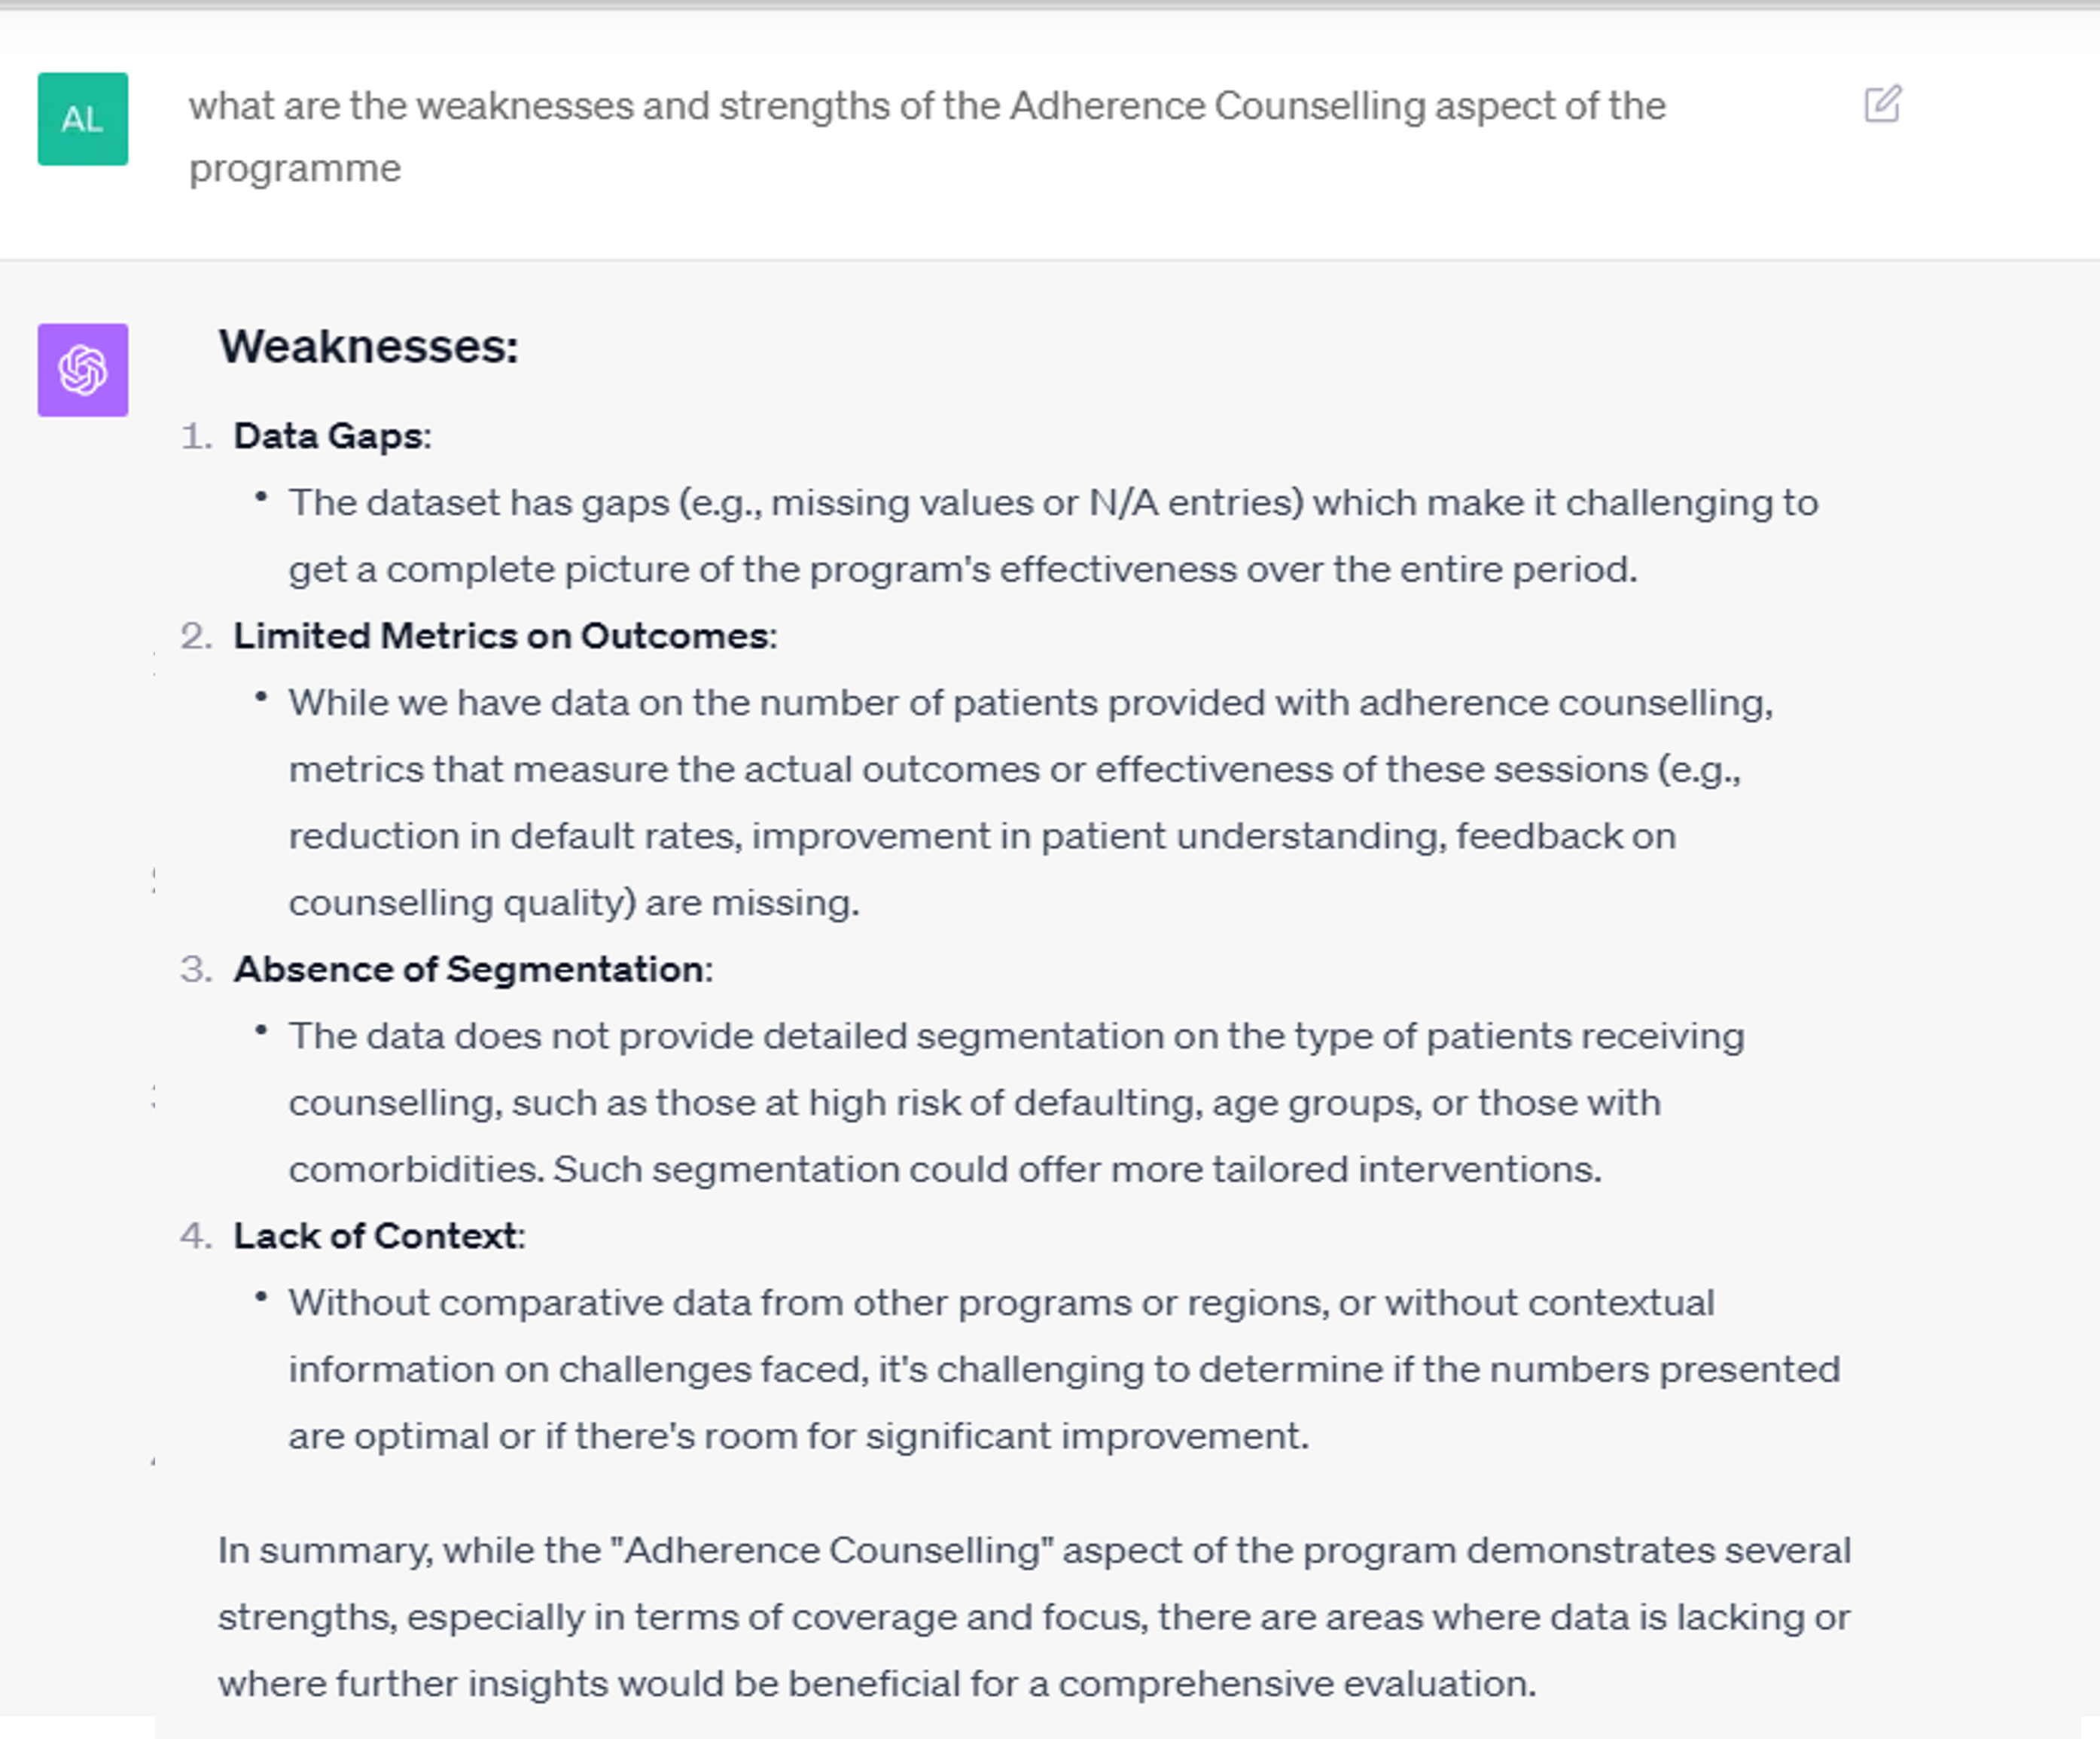
Adherence counselling programme weaknesses
Adherence counselling programme weaknesses
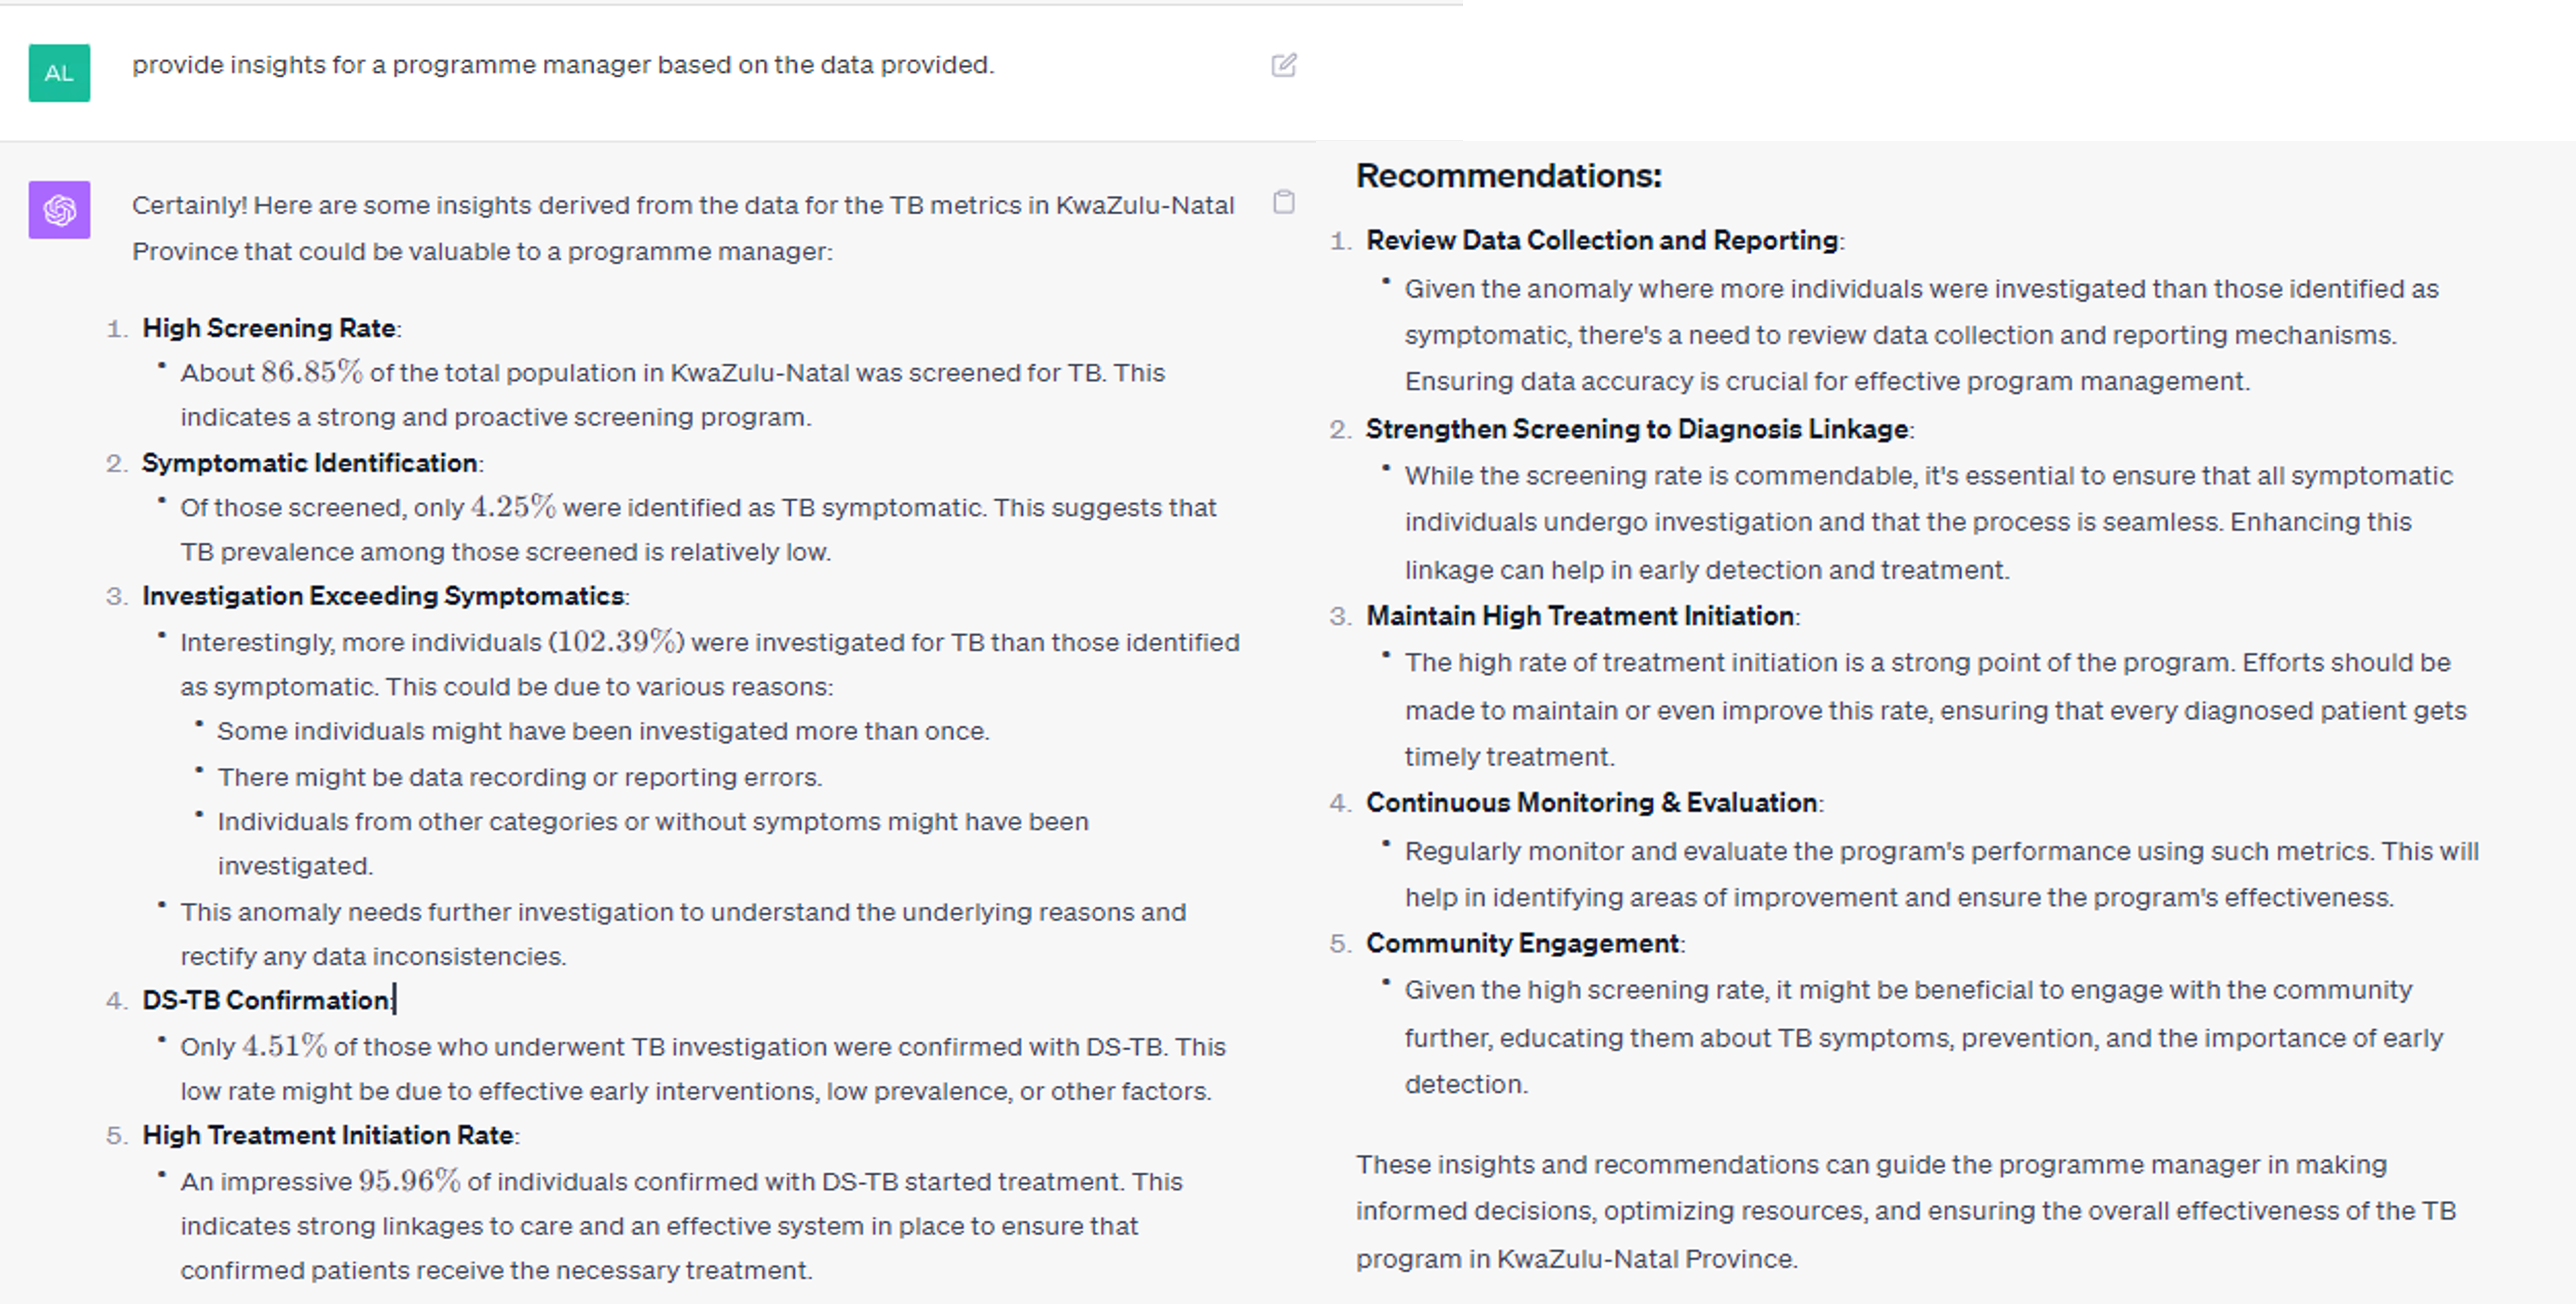
TB programme performance insights and recommendations
TB programme performance insights and recommendations
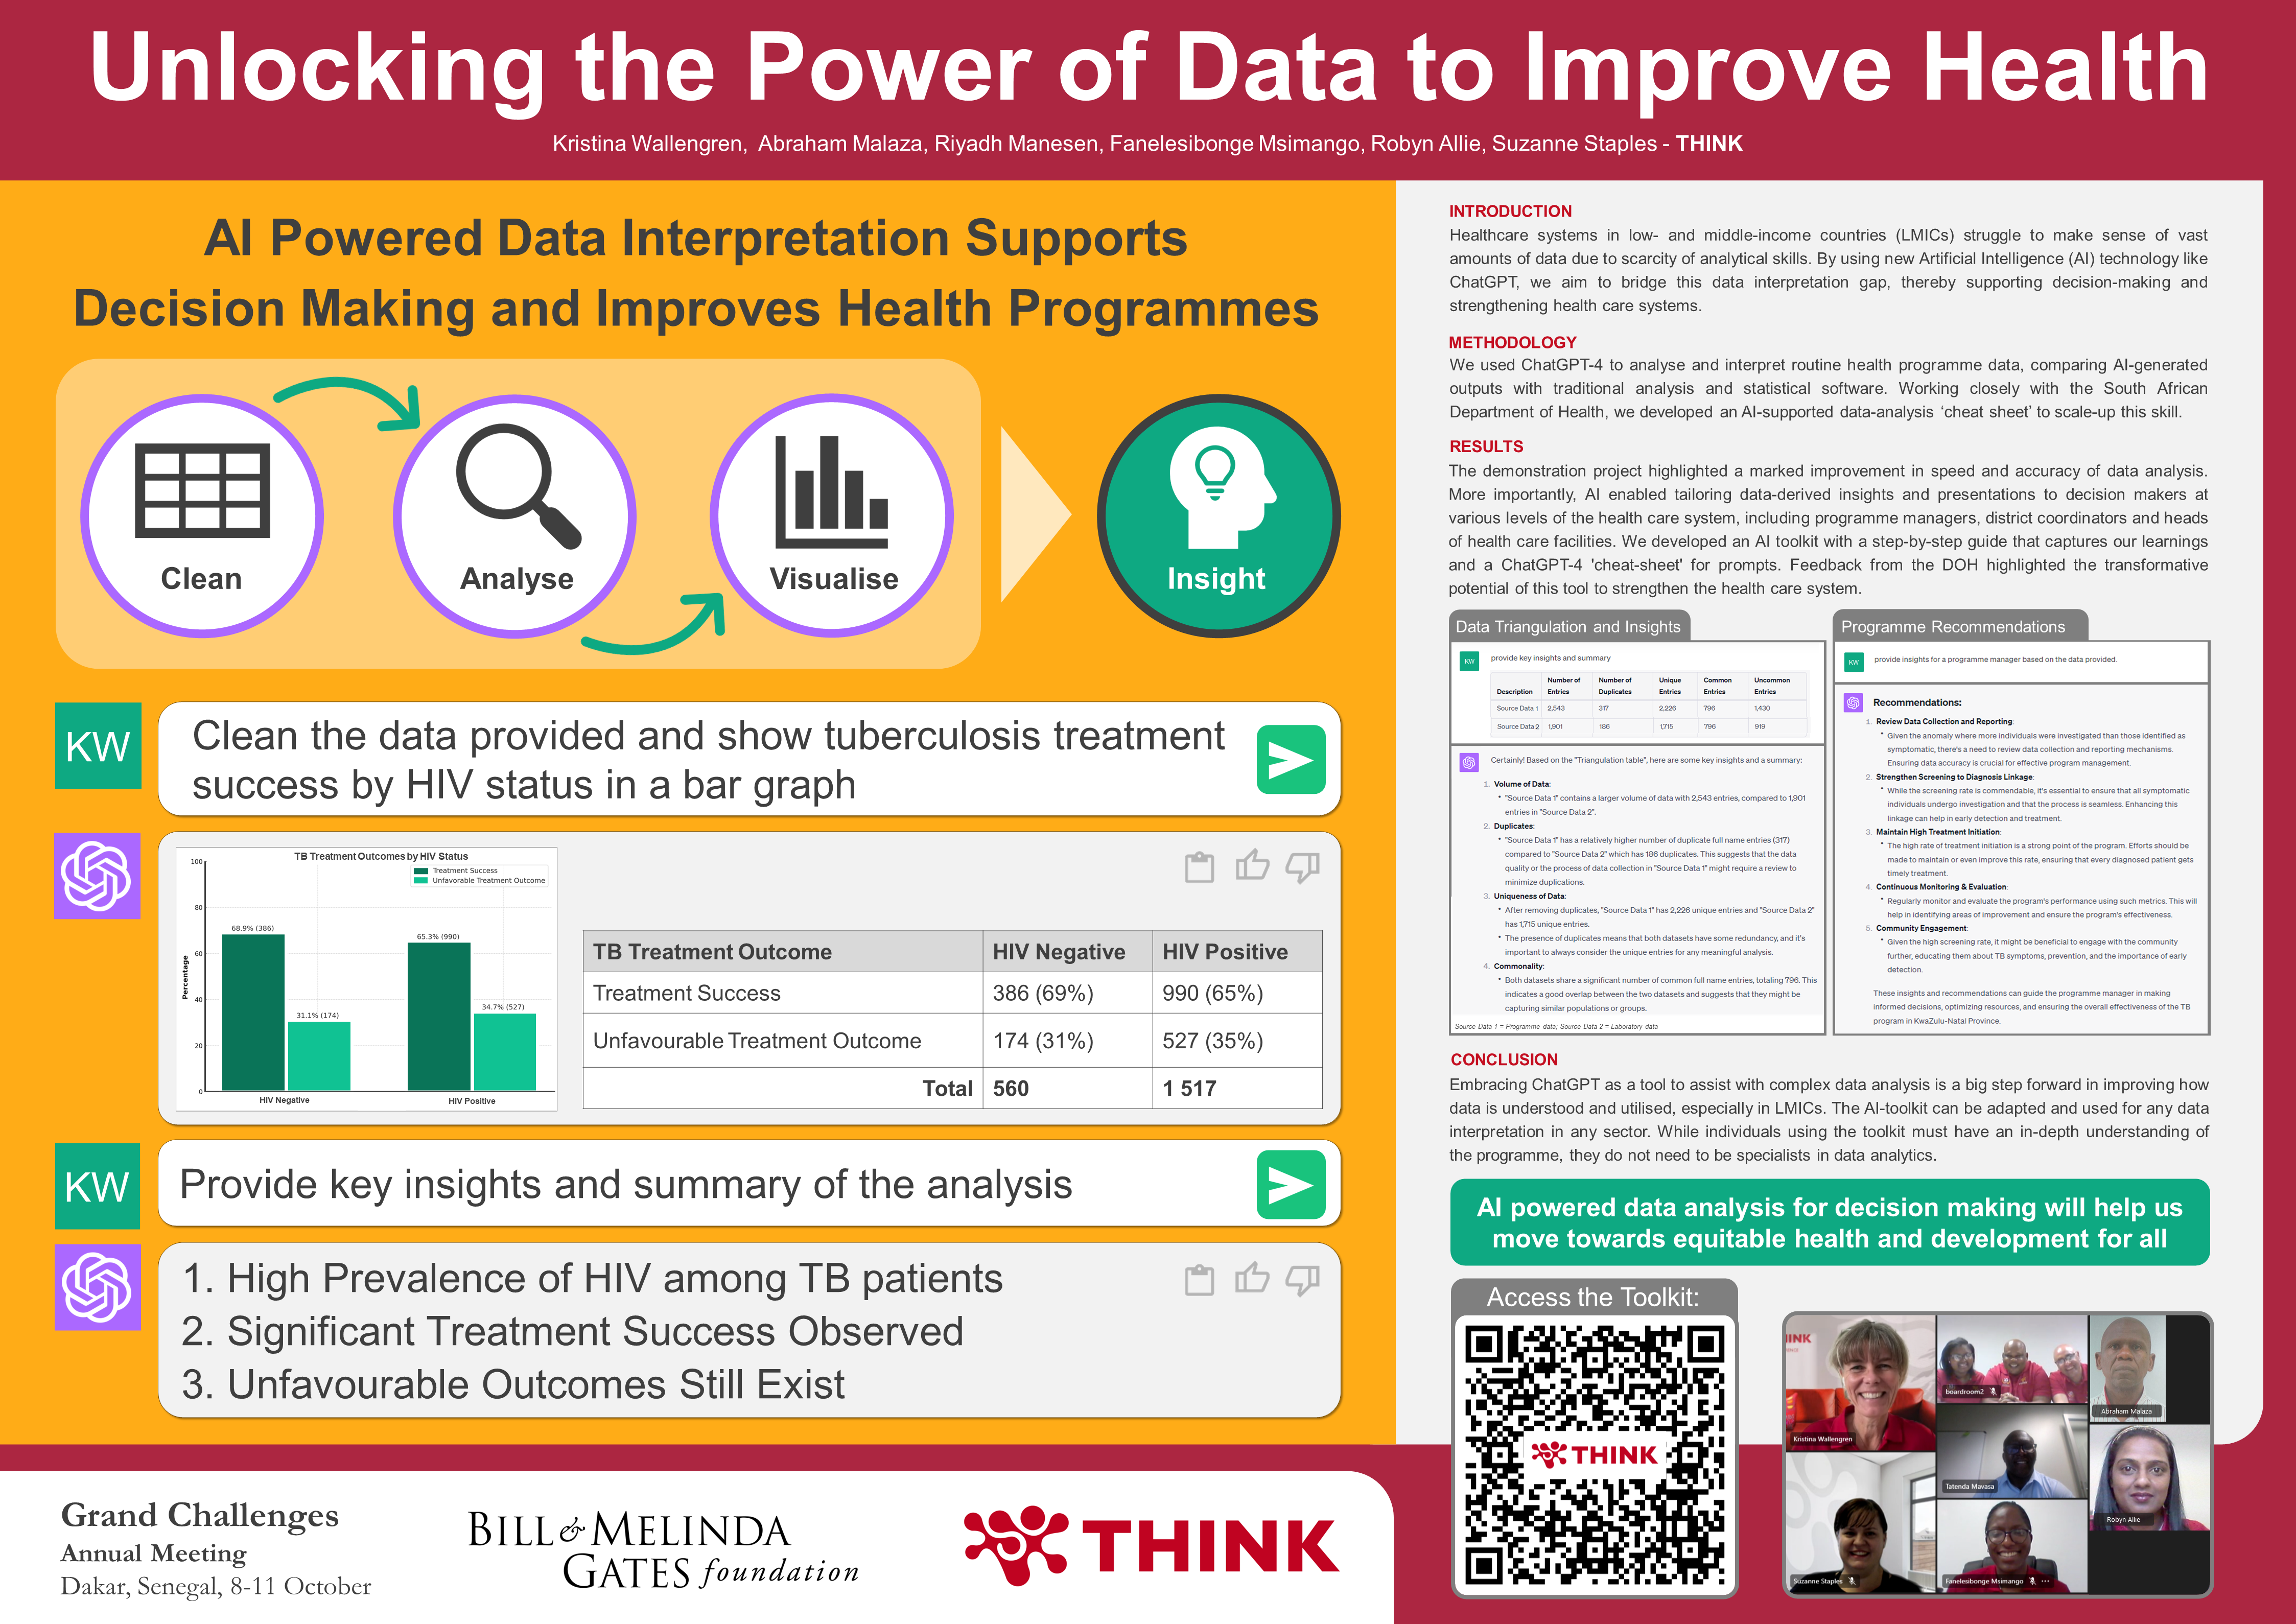
Unlocking the Power of Data to Improve Health
Healthcare systems in low- and middle-income countries (LMICs) struggle to make sense of vast amounts of data due to scarcity of analytical skills. By using new Artificial Intelligence (AI) technology like ChatGPT, we aim to bridge this data interpretation gap, thereby supporting decision-making and strengthening health care systems.
We used ChatGPT-4 to analyse and interpret routine health programme data, comparing AI-generated outputs with traditional analysis and statistical software. Working closely with the South African Department of Health, we developed an AI-supported data-analysis ‘cheat sheet’ (available to download below) to scale-up this skill.
Embracing ChatGPT as a tool to assist with complex data analysis is a big step forward in improving how data is understood and utilised, especially in LMICs. The AI-toolkit can be adapted and used for any data interpretation in any sector. While individuals using the toolkit must have an in-depth understanding of the programme, they do not need to be specialists in data analytics.
ChatGPT Data Analysis Toolkit
Tutorial Videos on how to setup and use ChatGPT for Data Analysis
Tutorial 1: Setup
Background and Basic Setup of ChatGPT
Tutorial 2: Upload
Preparing and Uploading Data to ChatGPT
Tutorial 3: Cleaning
Cleaning and Downloading Data with ChatGPT
Tutorial 4: Basic Analysis
Basic Data Analysis and Visualization with ChatGPT
Tutorial 5: Insights
Data Insights with ChatGPT
Tutorial 6: Performance Insights
Programme Performance Insights from ChatGPT
Tutorial 7: Strategic Insighs
Strategic Insights from ChatGPT
Tutorial 8: Ethics and AI
Ethics and Limitations of AI
SOP and Prompt Sheets for Data Analysis with ChatGPT

Use these guides to set up and use ChatGPT-4 for data analysis purposes:
NOTES:
-
Ensure that sensitive data is anonymized or encrypted before uploading for analysis. ChatGPT-4 respects user privacy, but it’s always a good practice to maintain data confidentiality.
-
Regularly check the OpenAI platform for updates or changes in features and functionalities.